
 KUWAIT: By the end of February 2017, the 11th month of the current fiscal year 2016/2017 ended and for the third consecutive month oil prices continued their consolidation around $50 per barrel. The average price for Kuwaiti oil for February was $52.4 per barrel. Consequently, the average price of the Kuwaiti barrel of oil during the 11 months period of the current fiscal year from April 2016 to February 2017- was $44.3, which is $9.3 per barrel, 26.6 percent, higher than the hypothetical price estimated for the current budget at $35 per barrel. The past fiscal year 2015/2016 which ended on March 31, 2016 scored an average price for Kuwaiti oil of $42.7 per barrel. This means the average price of oil for the past part of the current fiscal year is 3.7 percent higher than the average price of the barrel for the past fiscal year.
Kuwait is supposed to have achieved actual oil revenues in February about KD 0.9 billion. As such, it is assumed to have achieved oil revenues until the end of February -11 months- in the amount of KD
11.3 billion. Assuming that production and prices would continue at the current levels, Kuwait's oil revenues would score about KD 12.3 billion in oil revenues for the entire current fiscal year, which is 43 percent higher than the value of oil revenues estimated for the budget at KD 8.6 billion.
Adding an amount of KD 1.6 billion in non-oil revenues, projected budget revenues would score KD 13.9 billion for the entire current fiscal year. If that is achieved, and assuming spending all estimated expenditures in the budget at KD 18.9 billion, and without deducting what is transferred to the future generations reserve -- it is meaningless in case of a deficit funded by the general reserve or by borrowing guaranteed by the future generations reserve -- the actual deficit would score about KD 5 billion. However, this figure would be more or less subject to developments in oil prices during the last month of the current fiscal year. It naturally will be reduced by any cuts in the estimated expenses in the budget when actual expenses are reviewed in the final account. Under all circumstances, the current fiscal year will end with achieving real and continued deficit, and for the
second consecutive year, where it is expected to be estimated at KD 4-5 billion when the final account is issued.
Boursa Kuwait
The performance of February was less active than that of January 2017, which all indexes of value, volume, number of transactions and the general index (AlShall index) dropped. The boursa total liquidity scored about KD 866.4 million in February 2017. Making the Boursa total liquidity in two months at KD 2.052 billion (i.e. in 41 working days), or 71.4 percent of total liquidity in 2016. The daily average trading value scored about KD 50 million, less by about 7.1 percent than the daily average trading value for January 2017 (i.e. in 22 working days), while it rose strongly by about 4.3 times compared with the daily trading average value for 2016 and about 3.1 times compared to the daily trading average value for 2015. Liquidity trends since the beginning of the year still indicate that half of listed companies did not get except 3.1 percent only of that liquidity, including 50 companies there from which got about 0.2 percent only of that liquidity and 6 companies remained without any trading. 15 liquid companies, whose capitalization value is equal to 2 percent only of the value of listed companies, got 22.3 percent of the bourse liquidity. This means that the high liquidity activity still deprives about half of the listed companies from it, on the contrary, it strongly goes to valueless companies, presenting an unhealthy condition. The distribution of liquidity among the four categories of companies was as follows:
The Highest 10 percent in Liquidity:
18 listed companies contributed by 44.5 percent to Boursa Kuwait capitalization value while they took
about 53.3 percent of the Boursa liquidity, including 12 big companies which contributed by about 43.6 percent of the Boursa capitalization value and got about 77 percent of the liquidity of that category, and 6 small companies took 23 percent of the liquidity of that category whose capitalization value did not exceed 0.9 percent only of the value of all Boursa Kuwait companies. While some big companies obtained high deserved liquidity, deviation is still substantial towards small companies, a matter that should be monitored.
The Highest 10 percent in Capitalization
Value: this category contributed 70.6 percent of the Boursa capitalization value and took 31.9 percent of its liquidity. However, 10 companies within it contained obvious liquidity deviation which captured about 91.5 percent of the liquidity of that category leaving approximately 8.5 percent of the category liquidity for 8 other large companies. The Lowest 01 percent in Capitalization:
Value: the category contributed by 0.3 percent to the Boursa capitalization value but took 2.9 percent of Boursa liquidity. Six companies within this category captured 96.2 percent liquidity of this category, while 12 other small companies got only 3.8 percent of the category liquidity. That liquidity deviation in this category suggests a very high dose of speculation on some of its companies.
Boursa Kuwait sectors liquidity
There are 5 active sectors in the bourse that contribute 87 percent to its capitalization value and got 91.3 percent of liquidity suggesting conformity between liquidity and the weight of those sectors in the bourse value. But within those sectors there was deviation in the direction of liquidity. The financial services sector received 26.3 percent of bourse liquidity, equivalent to about 2.6 times its contribution to its capitalization value. The real estate sector got 21.4 percent of bourse liquidity which equals 2.7 times its contribution to its value. Note that the two sectors are speculative ones.
The banking sector got 21.9 percent of boursa liquidity which accounts for 45.5 percent only of its contribution to its capitalization value. This means its share of liquidity is less than half of its contribution to value. The banking sector is the more disciplined and more solvent and the more beneficiary from rising assets prices. The remaining 7 sectors, liquid and non-liquid all scored liquidity ratios close to their contribution to the bourse value.
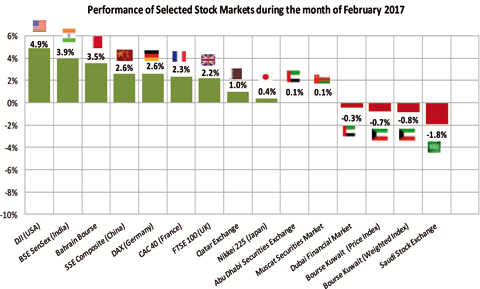
Comparative performance for selected markets
By the end of February, the second month of 2017 ended and still prevailed positive performance for the sample markets, in February, the performance of 11 markets was positive and only 3 markets achieved negative performance compared with January when 9 markets' performance was positive and 5 markets achieved negative performance. The outcome for the first two months of the current year was positive performance for 11 markets and 3 markets achieved negative performance. This means that 2 markets moved from the negative zone in the end of January to the positive zone by the end of February. The main gainer in February was the American market which gained 4.9 percent in one month and broke its record numbers. Most support came from President Trump's promises of expansionist financial policies, i.e. increasing public spending coupled with reduced taxes despite warnings of the Federal Reserve to start contracting monetary policies, i.e. to accelerate the increase of the interest rate.
The second gainer was the Indian market which achieved the highest economic growth rates among emerging economies. The third gainer was the Bahraini market which continues its strong positive performance since last January. The ranking of the biggest gainers in the first two months of the current year came slightly different. If Kuwait price index gains in two months (18 percent) was excluded because it is a wrong measurement index, the Kuwaiti market remains the biggest
gainer, whose weighted index achieved gains by 11.6 percent, despite losses of February followed by the Bahraini market by 10.6 percent gains and then Indian market by about 8 percent.
The biggest loser in February was the Saudi market whose index lost -1.8 percent continuing January losses. The second biggest loser was the Kuwaiti market whose weighted index lost about -0.8 percent.
The third loser was Dubai market whose index lost -0.3 percent. Which means that the three market losers in February were all from Gulf markets. The outcome of the negative zone markets since the beginning of the current year were losses by -3.3 percent for the Saudi market to occupy the bottom
of the negative zone, then the French market, and the Muscat market though with slight losses by -0.1 percent and -0.05 percent respectively.
Performance of selected stock markets during the month of February 2017 Reading through the performance of the first two months of the current year does not help us to reach a logical conclusion; the Kuwaiti market leads the gainers list and the Saudi market lies at the bottom of
the negative zone. The remaining markets include the rest of the Gulf markets and the
advanced ones with overlapping performances between them. The most affected markets hypothetically by the new American Administration's policies are close in ranking performance. The
American market came fifth in the positive performance, the Chinese came sixth, and the German came seventh while the Japanese and the French are among the last 4 positions. This in our opinion reflects a case of absence in the ability of dealers to be aware of prospects of developing total
variables together with hedging against risks to achieve gains in the short term.
Performance does not seem to differ in March. The end of last month speech of the American President was different and tends towards quiescence despite the repetition of the election campaign promises. Therefore, it is likely that the performance in March will be positive for most markets but without big gains or losses for the gainers or losers.
Ahli United Bank financial results FY 2016
Ahli United Bank (AlMutahed) announced results of its operations for the year ending December 31, 2016 which showed that the bank's net profit, after deducting taxes, scored about KD 37.6 million, up by KD 2.7 million, or by 7.8 percent, versus KD 34.9 million in 2015. This rise in the net profit due to a drop in total provisions by KD3.1 million, or by 7.6 percent. This erased the impact of the slight drop of the bank's operational profit by 0.7 percent. The bank achieved profits for its shareholders by KD 40.3 million, down by KD 2.5 million, or by 5.7 percent, compared with KD 42.8 million.
The bank's total operations incomes increased by less value than the rise in total operational expenditures, i.e. increased by KD 181 thousand, or by 0.2 percent, and scored KD 111.05 million compared with KD 110.87 million. This resulted from the rise in the item of net gain on sale of investments by about KD 2.1 million, to KD 3.5 million vis-à-vis KD 1.4 million, while the other items of operational incomes declined by KD 1.9 million, to KD 107.6 million compared with KD 109.5 million.
Total operational expenditures of the bank rose by KD 687 thousand, or by 2.1 percent, to KD 33.89 million compared with KD 33.2 million in 2015. Percentage of total operational expenditures to total operational incomes scored 30.5 percent versus 29.9 percent in 2015. Total provisions decreased by KD 3.1 million, or by 7.6 percent, as mentioned, and scored KD 37.5 million versus KD 40.6 million. Therefore, the net profit margin rose to 33.9 percent versus 31.5 percent in 2015.
Total bank assets scored about KD 3.692 billion, decreased by 5.4 percent, versus KD 3.904 billion in the end of 2015. Item of cash and balances with banks dropped by KD 300.3 million, or by 87.2 percent, and scored KD 44.1 million (1.2 percent of total assets) compared with KD 344.5 million (8.8 percent of total assets) in the end of December 2015. But item of financing receivables rose by KD 25.7 million to KD 2.706 billion (73.3 percent of total assets) vis-à-vis KD 2.680 billion (68.7 percent of total assets). Percentage of financing receivables to total deposits scored 84.7 percent versus 76.8 percent. Figures indicate that the bank's liabilities (without calculating total equity) decreased by KD 297 million, or by 8.4 percent, and scored KD 3.246 billion (KD 3.543 billion in the end of 2015). Percentage of total liabilities to total assets scored 87.9 percent versus 90.8 percent in 2015.
Results of analyzing the bank's financial statements indicate that most profitability indexes declined compared with the end of 2015. The return on average capital (ROC) dropped to 22.8 percent (23.2 percent). The index of return on average equities relevant to the bank shareholders (ROE) dropped to 10.9 percent (12.5 percent). But the index of return on average assets (ROA) rose slightly to 1 percent (0.9 percent). EPS scored 25.9 fils (27.4 fils in 2015). (P/E) scored 15.8 times -improved- (19.3 times) due to the drop in the EPS by 5.5 percent compared with a bigger decline in the share market price by 22.6 percent. (P/B) scored 1.6 times versus 2.3 times in the end of 2015. The bank announced intentions to distribute cash dividends by 12 percent of the nominal share value, i.e. 12 fils per share, and to distribute 8 percent as shares dividends. This means the share achieved cash yield by 2.9 percent on the closing price in the end of December 2016 at 410 fils. The cash distributions reached 5 percent in 2015 and distribute shares dividends by 10 percent.
The weekly performance of Boursa Kuwait
The performance of Boursa Kuwait for last week (4 working days due to the Liberation day holiday) was less active compared to the previous one, where all indexes showed a decrease, the traded value index, the traded volume index, number of transactions index, and the general index. AlShall Index (value weighted) closed at 407.7 points at the closing of last Thursday, showing a decrease of about 0.2 points or about 0.05 percent compared with its level last week, while it increased by 44.7 points or about 12.3 percent compared with the end of 2016.
AL-SHALL WEEKLY ECONOMIC REPORT


