
 KUWAIT: Activity in Kuwait's real estate market remained relatively weak with multiple factors dampening sales and lessening its appeal to investors. Seasonality, a strong 2014 and low oil prices have been the main sources of weakness. For the first nine months of the year, total real estate sales reached KD 2.3 billion, down 26% from the same period last year. Most of the real estate price indices continue to exhibit positive annual growth, to the exception of the residential home index that has been in negative territory since last month.
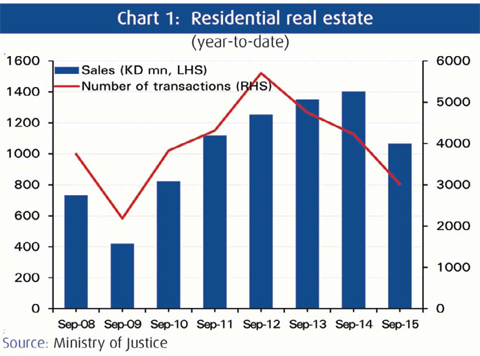
To date, total residential sales in 2015 reached KD 1,065 million, and were KD 82.2 million in September. KD volumes and number of units sold year-to-date (ytd) were both down 24% and 29%, respectively compared to the same period last year. One of the factors behind the steep decline in activity might be the government's commitment to distribute around 12,000 plots each fiscal year, which represents an increase from previous years.
Sales in the investment sector are comparable to 2011-2013 levels, as 2014 was exceptionally high for the sector. Total KD volumes reached KD 960 million ytd, a 33% decline from the same period last year; however 7% higher than the average sales in 2011-2013. In terms of transactions, 1,079 sale contracts were executed ytd, the lowest in five years.
Investors appear to shift their appetite towards the commercial sector, where sales activity also slowed, though less severely. KD sales volumes were down 4% to KD 297 million ytd. In September, the sector recorded 11 transactions worth KD 45 million. Transactions in the commercial sector increased 12% ytd driven by a growing demand for retail space by start-ups and SMEs primarily in the food and beverage industry.
Meanwhile, according to Ministry of Justice figures, a transaction for KD 9 million for a restaurant complex was recorded separately. Although classified as commercial property, restaurant complexes have increasingly attracted investors for their higher return on investment (ROI).
Significant slowdown
Surprisingly, the significant slowdown in real estate activity since the beginning of the year has exercised minimal pressure on real estate prices so far. In fact, growth rates of the real estate indices trended slightly downward in September but remain up year-on-year (y/y). The investment building price index leads the pack with double digit growth of 16.4% y/y, followed by residential-land at 4.2% y/y. The residential-home price index trailed behind, logging negative growth of 1.8% y/y for the second consecutive month, signaling potential softness in prices.
The market appears to be set for another correction in residential home prices. In September, the NBK residential-home index stood at 175.8 points, 1.8% lower y/y. The residential home price index has been trending slowly but steadily upward since 2006, although it seems to have flattened in recent months. However, the y/y growth rate depicts a different picture. From 2006 to date, the y/y growth of the residential home index peaked twice, the first time in December 2007; it peaked again in September 2013. During the first correction episode, the index's growth remained in negative territory for 12 consecutive months between November 2008 and October 2009, during which Brent averaged $56.8/bbl and recorded a low of $36.2/bbl in December 2008. Since the second peak in September 2013 (25 months to date), the annual growth has been steadily slowing and went into negative territory the last two months.
The market could be set for further correction in residential home prices as oil prices averaged $56/bbl since the beginning of the year and sales and price growth have slowed; however it is premature to forecast a "recession-like" period for residential home prices.
On the other hand, the NBK residential-land index appears now to be stabilizing after a correction during the first five months of the year. The index is up 4.3% for the year; though relatively flat for the month at 198.9 points. Out of the 16 areas included in the index, only four areas exhibited a decline in the average price/sqm for the first nine months of the year of around 1%.
Growth in the investment building price index remains in double digit, though it has been slowing down in 2015. To date price growth averaged 14.6%, almost half the average growth recorded for the same period last year. The investment building price index stood at 214.3 points, 5% lower than in August. Out of the 11 areas included in the index, 7 areas showed negative average growth in price/sqm for the first nine months of the year, with Abu Halifah, Jabriya, Salmiya and Farwaniya retreating the most by around 5%.


